
Line Chart with Svelte
In this Tutorial, we will create a Line Chart Svelte Component, which we can use in our Svelte Applications. We will use Scalable Vector Graphics (SVG) which are HTML. With SVG’s help, we can create a Line Chart with a few lines of code. We will also use Svelte’s reactive variables to make the Line Chart interactive.
We’ll also style it with CSS / SCSS. Below you will see what we will create today.
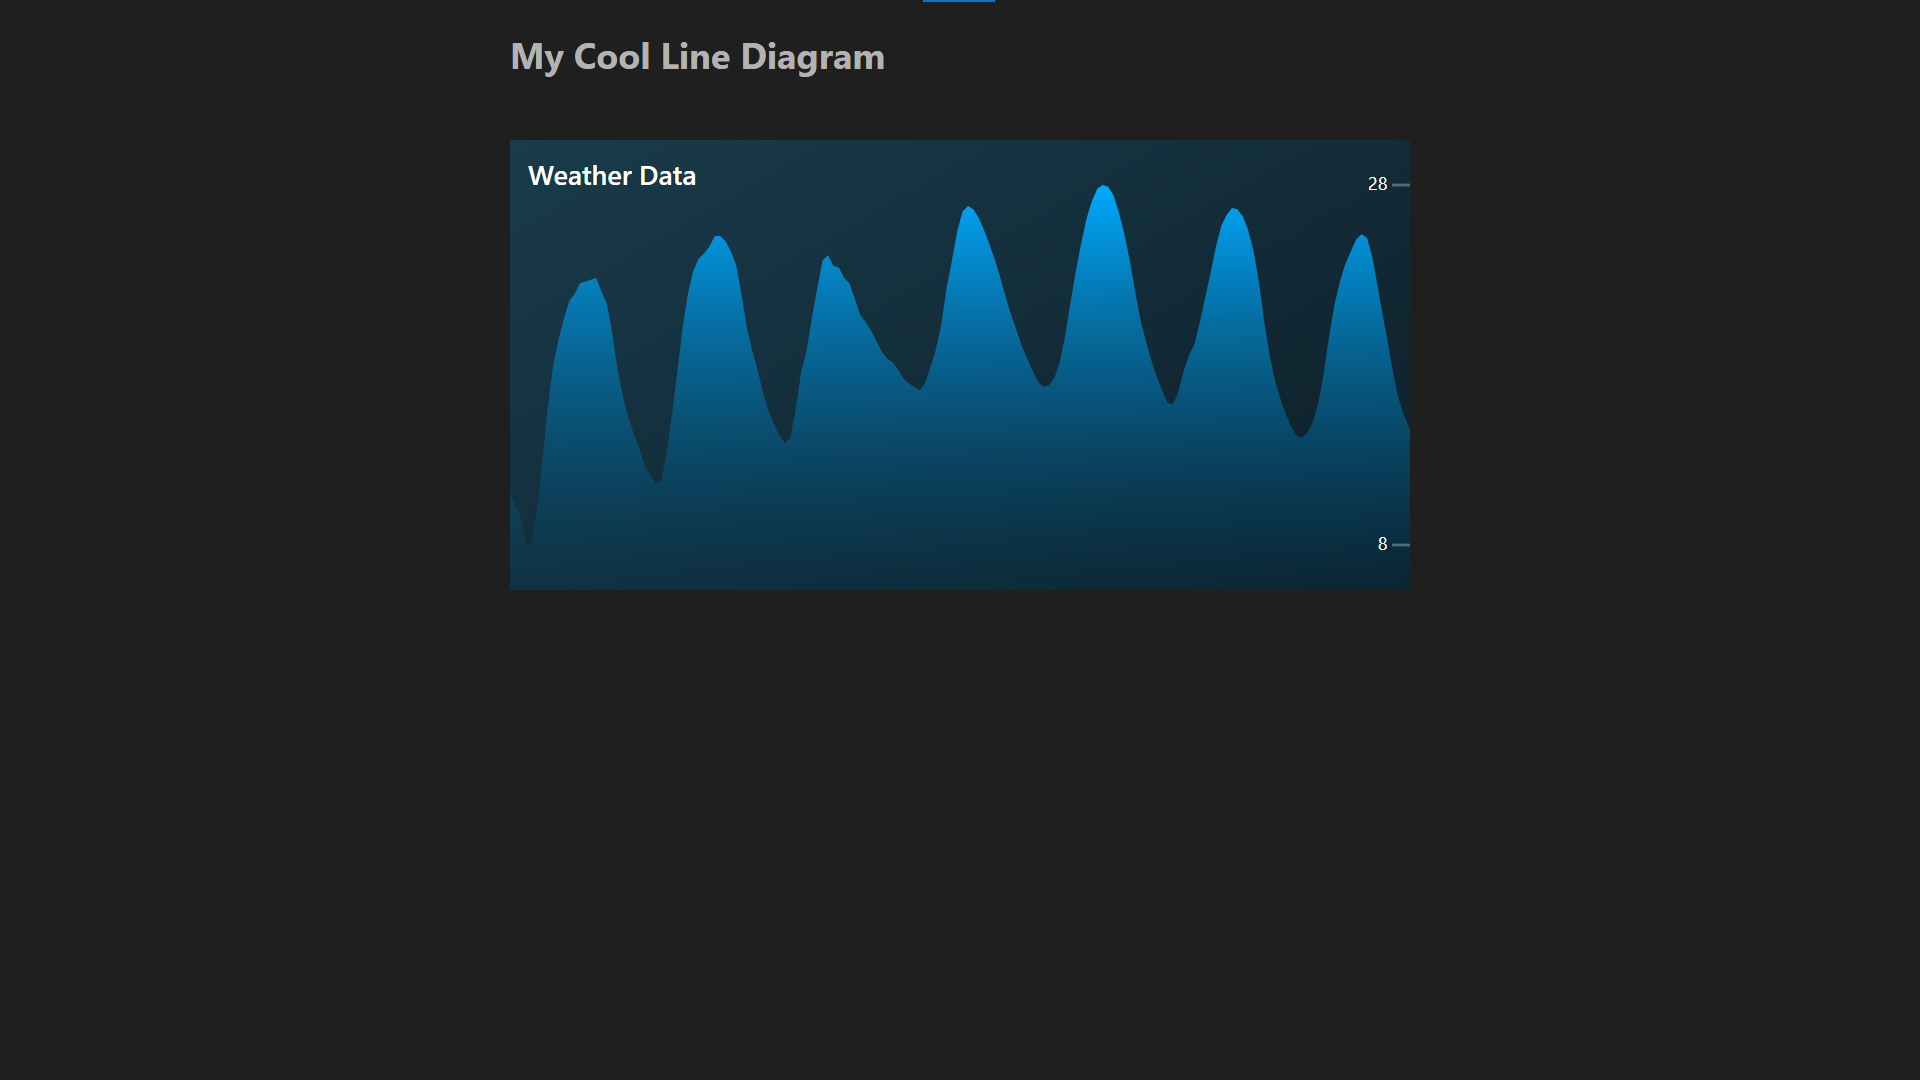
Within the Component, we’ll distribute the given data into a range to fit into the Diagram; this Behavior may be nothing for you, so your main takeaway could be how incredible SVG is and how easy it is to create Graphics with it.
First, we will create the Line Chart Component. Then we will use it in a Svelte Application.
Let’s get started.
You’ll find the Demo for the finished code here.
¶Line Chart Component
The Component consists of a script tag, a div container with an SVG, and a style tag.
¶Script of the Line Chart Component
Within our line-diagram.svelte file, we start by exporting a name and values property. The name property will be used as the title of the Diagram, and the values property will be used to draw the Diagram. The values property is an array of numbers.
Next up, we define the Diagram’s height, width, and vertical padding; these numbers are mainly arbitrarily chosen to fit the Diagram. Because later down the line, we will fit all the data within this range.
Furthermore, we will get the highest and lowest value of the dataset, and calculate the proportions between our desired range and the range of the data. This will be used to scale the data to fit the Diagram.
This all sounds rather complicated, but bear with me here.
<script lang="ts">
    export let name : string = ''
    export let values : number[]

    // These values are arbitrarily chosen to fit the Diagram
    let height = 50;
    let width = 100;
    let padding = 5;

    $: highestValue = values.reduce((a, b) => Math.max(a, b))
    $: lowestValue = values.reduce((a, b) => Math.min(a, b))

    $: multiplier = ( height - 2 * padding ) / (highestValue - lowestValue);

    ...
</script>
Lastly, within the script tag, we’ll define a reactive variable, path which will be used to draw the Diagram. Then we use a reactive block to calculate the path. The path is a string containing the SVG Path commands to draw the Diagram.
let path = ''
$: {
    path = "M0 " + (height);
    for (let i = 0; i < values.length; i++) {
        let yValue = height - (((values[i] - lowestValue) * multiplier) + padding) ;

        let xValue = i / (values.length - 1) * width;

        path += " L " + xValue + " " + yValue;
    }
    path += " L" + width + " " + height;
    path += " L 0 " + height;
    path += " Z";
}
¶HTML of the Line Chart Component
Next, we will create the HTML for our Component, consisting of a div container with an SVG. The SVG has a viewBox which defines the size of the SVG. The viewBox is a string that contains the x and y position of the top left corner and the width and height of the SVG. We will use the width and height variables we defined earlier.
We also set the preserveAspectRatio attribute to none so the SVG will scale to fit the container.
<div class="container">
    <svg
        class="diagramm_svg"
        viewBox={"0 0 " + width + " " + height}
        preserveAspectRatio="none"
        >

        <!-- More to Come -->

    </svg>
</div>
We start by defining a defs tag within the SVG. The defs tag is used to define SVG Elements, which can be reused within the SVG. In our case, we will define a linear gradient which we will use to fill the line of the Diagram.
After that, we create this line with a path element. The path is defined by the path variable we defined earlier. This path element uses the gradient by referencing it by its id in the fill attribute.
<defs>
    <linearGradient id="gradient" x1="0" x2="0" y1="0" y2="1">
        <stop stop-color="hsl(200 100% 50%)" offset="0%" />
        <stop stop-color="hsl(200 100% 20% / 0.2)" offset="100%"/>
    </linearGradient>
</defs>

<path d={path} class="line" fill="url(#gradient)"/>
Lastly, we add text labels to our Diagram. Mind the text-anchor and dominant-baseline attributes.
<!-- Show Labels -->
<text x={width - 2.5} y={height - padding} class="label_text" text-anchor="end" dominant-baseline="middle">{ Math.round(lowestValue) }</text>
<line x1={width - 2} y1={height - padding} x2={width} y2={height - padding} class="label_line"></line>

<text x={width - 2.5} y={padding} class="label_text" text-anchor="end" dominant-baseline="middle">{ Math.round(highestValue) }</text>
<line x1={width - 2} y1={padding} x2={width} y2={padding} class="label_line"></line>

<text x="2" y={padding} class="title_text">{ name }</text>
¶CSS of the Line Chart Component
Lastly, we add some CSS to our Component. We will use SCSS for this. We start by defining the container and the SVG. We also add a border to the SVG so we can see the size of it. I won’t go over it, but you see the code below.
.container {
    background-color: hsl(200 50% 20%);
    background: linear-gradient(150deg, hsl(200 50% 20%), hsl(200 50% 10%));
    height: 100%;
    display: flex;
    flex-direction: column;
    justify-content: center;

    .diagramm_svg {
        width: 100%;
        height: 100%;

        .label_line {
            stroke-width: 0.3px;
            stroke: hsl(200 0% 100% / 0.3);
        }

        .title_text {
            font-size: 3px;
            fill: white;
            font-weight: 600;
        }

        .label_text {
            font-size: 2px;
            fill: white;
            text-align: right;
        }
    }
}
¶Using the Line Chart Component
Now how do we use this Component? To demonstrate this, I will use the Weather API that I have used in this article to make a simple diagram.
We start by fetching the API URL and getting the json for it. We can then put this data into the weatherDataPromise variable.
async function getWeatherData() {
    const response = await fetch(`https://api.open-meteo.com/v1/forecast?latitude=52.52&longitude=13.41&hourly=temperature_2m`)
    return await response.json()
}
let weatherDataPromise = getWeatherData()
Lastly, we use the svelte await block to wait for the promise to resolve. We then pass the data to our LineDiagram Component.
<div class="container">
  <h2>My Cool Line Diagram</h2>

  <br>
  <div class="weather_container">
    <!-- Await -->
    {#await weatherDataPromise}
      <p>Waiting for weather data...</p>
    {:then data}
      <LineDiagram values={data.hourly.temperature_2m} name="Weather Data"/>
    {:catch error}
      <p style="color: red">{error.message}</p>
    {/await}
  </div>
</div>
¶Conclusion
That’s it; I hope you had a good time reading and that you learned something new. As you see, SVG is mighty when used correctly and dynamically. You can, for example, make a Responsive Dog.


Leave a Reply